
Research
Testing the ICT Silver Bullet
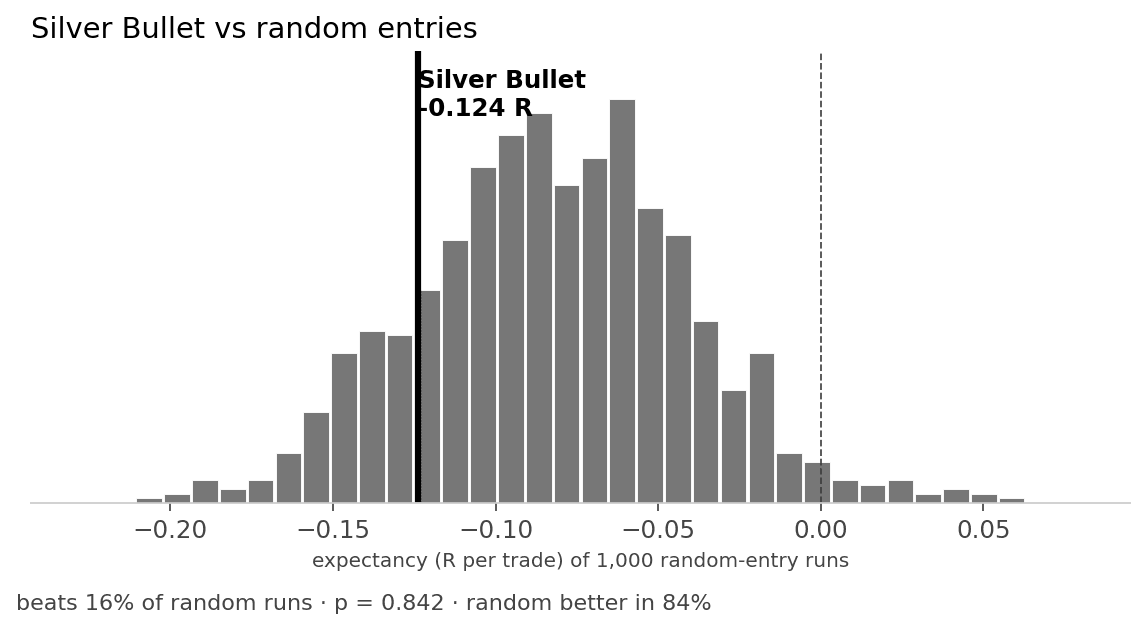
We tested the ICT Silver Bullet on QQQ — 1,145 trades across 23 years.
Win rate 30.3% (2R breakeven = 33.3%) · expectancy -0.124 R after costs.
Random was better 84% of the time.
What the sample shows
- 1,145
- 23
- 30.3%
- -0.124 R
Silver Bullet vs random entries
Same days, same stop distance and 2R target, random minute and direction.
Rules locked before the result
Rules were written and hashed before any Massive data run. On QQQ from 2003-09-10 to 2026-10-13, the New York 10:00–11:00 Silver Bullet window was coded as a single first-FVG fill with a 2R target, after costs. Each traded day was also replayed with a random minute and direction (1,000 runs) so the real expectancy can sit on a null distribution instead of a story.